


I like to measure things. I mean, I really like to measure things. Not entirely sure where that comes from, possibly my love of The Count on Sesame Street during my younger days, or possibly stemming from my philosophical positions on the nature of knowledge and reality: I believe that any exploration of natural events that includes a cause-and-effect question requires that those natural phenomena can be quantified at some level. But it’s probably The Count.
I ‘grew up’ a measurement and knowledge translation scientist through most of my formative years as an independent academic and continue to work actively in that field. My favourite projects are those in which I and my collaborators have identified a gap in available tools and created something entirely new from the ground up. One of our first was the Traumatic Injuries Distress Scale (TIDS). After 11 iterations that tool now appears to be functioning quite well for establishing prognosis after acute MSK trauma, is available in English, French and Spanish, and has been programmed into the Focus on Therapeutic Outcomes (FOTO) database that is widely used as a PT outcomes collection system in the United States. The second tool, borne out of an important question in prognosis research of ‘What, exactly, are we trying to predict?’ is the Satisfaction and Recovery Index (SRI). That one was built from concepts derived from patient focus groups on the nature of recovery. It taps a construct we’ve termed importance-weighted health-related satisfaction and can most easily be described as the offspring of an entirely patient-driven tool like a Patient Specific Functional Scale (PSFS), and an entirely standardized tool like a Brief Pain Inventory (BPI). If the BPI included more generic items and allowed respondents to nominate which of those were important a la the PSFS, you’d have the SRI. Both the TIDS and SRI are currently freely available for anyone to use and can be downloaded from my lab website at http://www.pirlresearch.com/clinician-resources/.
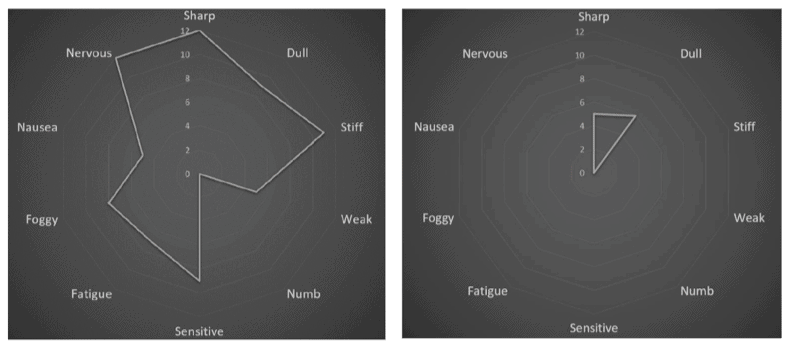
Both the TIDS and SRI required some novelty in how they were scored or interpreted, but were relatively easy compared to our newest tool, the MultiDimensional Symptom Index (MSI). The MSI is entirely focused on the symptom components pulled from those same patient focus groups around the nature of recovery. When we posed the question to people with MSK pain ‘How will you know you’re recovered?’ not surprisingly many of the responses related to symptoms. Interestingly however, it was not only pain that they described, but a range of symptoms that included weakness, stiffness, environmental sensitivities, nausea, and negative affect. Also interesting was that the nature of their comments were not only about reduced intensity of their symptoms, but many also indicated they would know they were better if a) they could do more despite their symptoms, and b) they didn’t experience their symptoms as often. Symptom interference is not a new construct, but symptom frequency is not commonly measured in clinical outcome tools. So we took this information and created the MSI, which presents the 10 most common symptoms described by our participants, and asks respondents to first indicate how often they experience each one, then to indicate the degree to which that symptom interferes with their ability to engage in activities. So it is two scales side-by-side: a frequency scale, and an interference scale. On the surface this already provides 3 metrics from a single tool: 1. The total number of symptoms experienced, 2. The mean frequency of those symptoms and 3. The mean interference as a result of those symptoms. As the mean frequency and interference are functions of the number of symptoms endorsed, the tool works for those with a single symptom type as well as it does for those with 10 symptoms types. While the combination of interference and frequency was novel, I wanted a way to integrate both into a single score. This was not as obvious as it seemed: should we simply sum the frequency and interference scores? Multiply them? Create some kind of regression equation? None of those seemed right, so I engaged with health economist Dr. Jackie Marsh who took one look at the tool and immediately said “ah, you’re clearly talking about health valuations here”. To which I stared dumbly. To my fortune Jackie worked with me to devise a study in which we created all 120 possible combinations of symptoms (10) x frequency (3) x interference (4) and called those ‘health states’. We then presented all 120 in random order to 100 people and asked them to rate, on a 0-100 scale, how far from perfect health each state fell. So ‘stiffness that is rarely present and barely noticeable’ might be rated close to 100, while ‘sharp pain that is constantly present and so intense I have to immediately stop what I’m doing and seek relief’ would likely be rated closer to 0. In this way every frequency x interference combination for all 10 symptoms could be ranked based on their mean health valuations, creating a custom 0-12 scale for each symptom. This then allowed further evaluation of the scale properties, including factor structure that revealed two subscales: Somatic Symptoms and Non-Somatic (Central) Symptoms. Even more cool, the ability to create a “phenotype” radar plot for each patient based on their responses. This does add burden to the tool, but for those wishing to use it a custom spreadsheet has been created to make the process far speedier (seconds) and mobile and web-based apps are currently under development.
The MSI breaks many of my own rules about measurement, including that tools should not capture multiple constructs in a single score, but through using a health valuations approach this suddenly makes sense. I have become excited by the concept of ‘rich assessments’, tools that can tap multiple domains of health with a single test, and the MSI certainly fits that bill. With scores for symptoms, frequency, and interference, as well as subscale scores of somatic and non-somatic symptoms and a patient phenotype all from a single piece of paper, I expect this tool will also improve assay sensitivity in pain research. Ongoing work is underway to better understand further properties of the MSI. I hope clinicians will find value in it especially as we move increasingly towards electronic data capture where the burden of scoring a tool is no longer an issue.
The MSI is not currently openly available, but those who wish to review it are free to contact me at dwalton5@uwo.ca.
Dave Walton
 Dave Walton is an Associate Professor with the School of Physical Therapy at Western University (Ontario Canada) where he teaches and is Director of the Pain and Quality of Life Integrative Research Lab. He also holds appointments as Associate Scientist of the Lawson Health Research Institute, Honorary Associate Professor at the University of Sydney’s Discipline of Physiotherapy, Scientist with Western’s Bone and Joint Institute, and is an Associate Editor with the scientific journal Musculoskeletal Science and Practice. He currently holds the titles of Faculty Scholar and Teaching Fellow for Western’s Faculty of Health Sciences, and is a member of the IASP Global Year for Excellence in Pain Education Steering Committee. His research foci are in the areas of clinical measurement, mechanisms of pain persistence, and mobilization of knowledge to affect clinical behaviour change. He is a fan of the Toronto Blue Jays, the blues harmonica, and barbecue cuisine.
References
Walton DM, Krebs D, Moulden D, Wade P, Levesque L, Elliott J, MacDermid JC. (2016). The Traumatic Injuries Distress Scale: A New Tool That Quantifies Distress and Has Predictive Validity With Patient-Reported Outcomes. J Orthop Sports Phys Ther. 46(10):920-928.
Walton DM, MacDermid JC, Pulickal M, Rollack A1, Veitch J. (2014). Development and Initial Validation of the Satisfaction and Recovery Index (SRI) for Measurement of Recovery from Musculoskeletal Trauma. Open Orthop J. 30;8:316-25.
Walton DM1,2, Marsh J1,2. (2018). The Multidimensional Symptom Index: A new patient-reported outcome for pain phenotyping, prognosis and treatment decisions. Eur J Pain.;22(7):1351-1361.